© Cosmopol | Stock Free Images & Dreamstime Stock Photos
It doesn’t take long for new analysts to learn that copying and pasting code really speeds up the time needed to complete any job. This seems to be especially true when you need to create groups of new variables, or when performing the same transformation to a set of fields.
The reality is that copying and pasting code in these instances is actually the long way of accomplishing a task. Sure, the code will be easy to read. But you could complete the same tasks in a fraction of the time.
Fortunately, Stata has a set of built-in tools to make this process easier.
This article will show you how to use the -forvalues- command in Stata in order to automate repetitive tasks. Learning how to use this tool will help make your data analysis code cleaner, shorter, and faster to write.
Loops: they do a program good
Early on in their education, every programmer learns about loops. Loops tell a computer to perform a task or set of tasks repetitively, according to a specific set of criteria.
Usually we want to automate a task to be performed across a set of variables, perform the same commands using different numeric values in each iteration, or repeat code with each item from a given list.
This is what computers do best. In fact, some programmers would say that if you write the same piece of code more than once in a program, you’re wasting your time.
A good example of how loops are useful comes from working with decennial census data. A frequent task that analysts need to perform is the estimation of data values for intercensal years (those that fall between census collection points). Perhaps the simplest method for accomplishing this task is to use linear interpolation between the decennial census values. Calculate the average annual change in the data value using the decennial data points. Then generate nine new variables, adding the change value to each successive field.
The simple code to interpolate data between variables x1990 and x2000 might look something like this:
gen xdelta = (x2000 – x1990) / 10
gen x1991 = x1990 + xdelta
gen x1992 = x1991+ xdelta
gen x1993 = x1992 + xdelta
gen x1994 = x1993 + xdelta
gen x1995 = x1994 + xdelta
gen x1996 = x1995 + xdelta
gen x1997 = x1996 + xdelta
gen x1998 = x1997 + xdelta
gen x1999 = x1998 + xdelta
First of all, this code works. It makes sense, it’s easy to read, and it does the job we set out to do. For some analysts, this is enough and there’s no need to get fancy.
What if you had to do this 30 or 40 times…or 100…or 500. Are your eyeballs spinning yet?
With a loop, this procedure can be accomplished with only three lines of code:
forvalues y = 1991(1)1999{
    gen x`y' = x1990 + (`y' – 1990)*((x2000 – x1990) / 10)
}
Let’s dig in…
How to Use -forvalues-
In the example above, I use Stata’s -forvalues- command to create nine new variables. Each variable represents the next step in a linear progression from the x1990 value to the x2000 value.
The -forvalues- command consists of two pieces of code that work together:
1. The portion that controls where the loop begins, and how long the program should loop for.
2. The commands that you want to have repeated during each segment of the loop.
Conceptually, the command looks like this:
forvalues “loop control” {
    repeated command
}
The loop control begins by specifying the name of a local macro used to refer back to the values you are looping through. In this example, I use y as the name of the local macro.
The next section of the loop control specifies the starting value for y, how much to increment y by with each loop, and an ending value. So, I start the loop with y = 1991. With each successive run through the loop, Stata will increase that value by 1. And the loop will end at 1999.
The repeated command tells Stata what to do with the values in the loop control section. In the code above, Stata creates nine new variables (x1991 to x1999) using the -gen x`y'- command. Here `y' is used to refer to the local macro defined in the loop control.
As the -gen- command creates each of the new variables, they are set equal to the value of x1990, plus some number of years (`y’ – 1990), times the average annual change in the x variable ((x2000 – x1990)/10).
There are a few simple rules you need to follow when using the -forvalues- command:
1. The open brace ({) must be on the same line as the -forvalues- command.
2. The first command to be executed within -forvalues- must be on a new line.
3. The close brace (}) must also be on a line of its own.
4. The -forvalues- looks for numeric values in the local macro of the loop control. If you want to use strings (i.e. text values), you’ll need to use -foreach- instead.
An Illustrated Example
Here is some example code, with the output so you can try for yourself. Begin by creating a small fake data set to work with. Make sure you include the -set seed 12345- command so you get the same results I show below.
clear
set seed 12345
set obs 10
gen x1 = rnormal()
gen x5 = abs(x1) + rnormal()
gen delta = (x5 - x1)/4
list

forvalues v = 2(1)4 {
    gen x`v' = x1 + (`v' - 1)*((x5 - x1)/4)
}
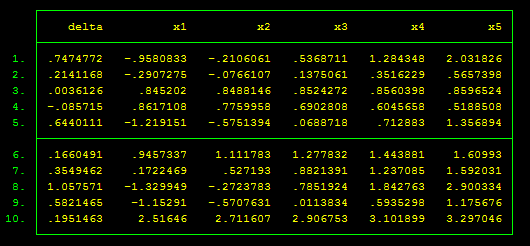
list delta x1 x2-x4 x5
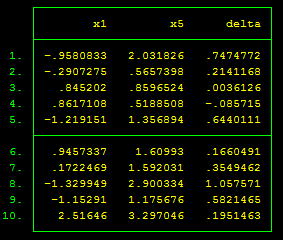
Your results after the first -list- command should look like the figure below:
The -forvalues- loop simply generates three new variables (x2 – x4) that represent the interpolated values between x1 and x5. If all went well, your results should look like the figure below. Notice that the values from x1to x5change by the value of deltawith each step.
I hope this post takes some of the mystery out of the -forvalues- command. In upcoming posts, I’ll show you how to use the -foreach- and -while- command to create loops for different scenarios.
If you have any questions, feel free to ask them in the comments below. And don’t forget to subscribe to this blog via email to get the follow-up posts and new content as I post it!
Happy coding!


Hello,
it’s smart to have such a command. Help saving lot of time and patience. I have a question probably related loop command but I don’t know how to do it. Suppose I have initial four observations, let say income of four different families a b c and d, now I want to compute the variable which is difference of household income by bilateral comparison, such as need to compute (a-b), (a-c), (a-d), (b-c), (b-d) and (c-d). So the new variable will have n(n-1)/2 number of observation with n original number of observation. Imagine you having 100 original observations, is there a way to compute new variable with 100*(100-1)/2 obs. Definitely saving huge time and effort in computing this.
Do you have any advice for this query.
Thanks lot
Cindy
Pingback: Simulating Data with A Known Correlation Structure in Stata | 123
Thanks. This was helpful and clear! I appreciate the explanation of what the loop is doing conceptually, and it helped me fix my code!